Dallas Real Estate Market - 2023-03
Summary
The market trends of March 2023 are as follows(Check out the charts below for details).
Key Takeaways
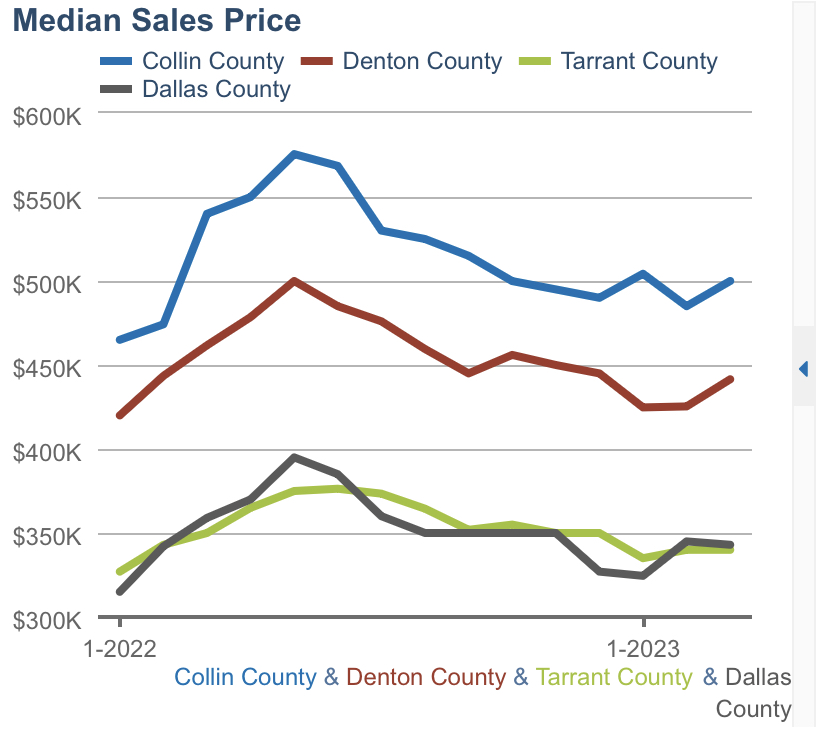
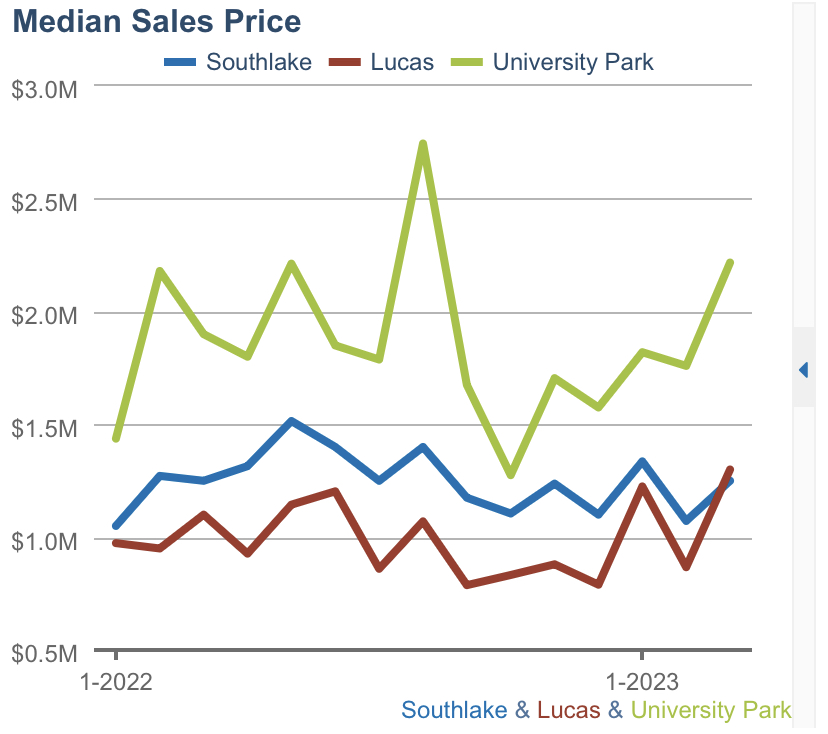
1. Because of the seasonality of real estate market, the price of whole market keeps climbing up, but the price is still lower than last year in major market.
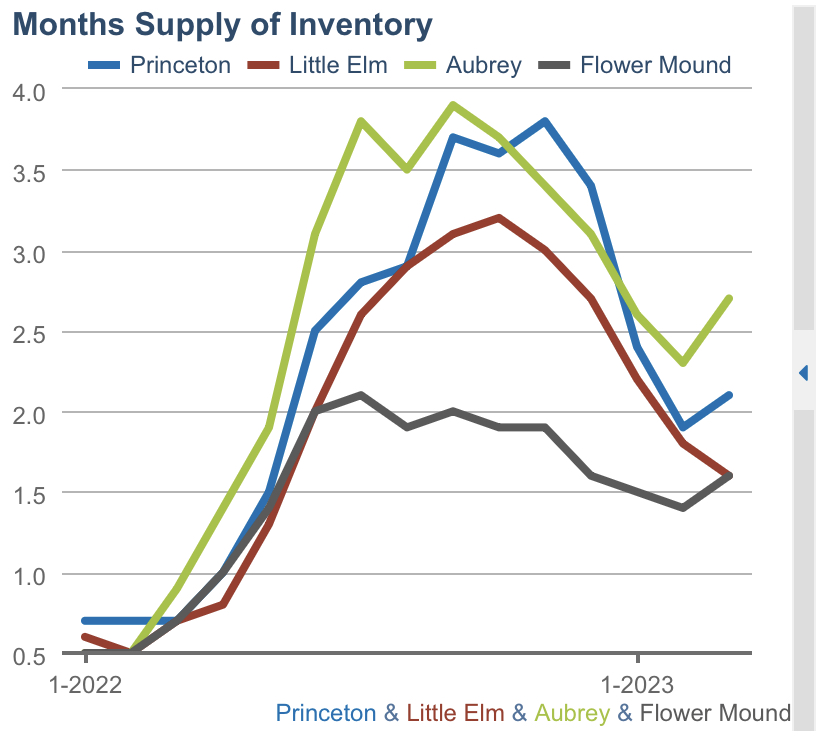
2. The inventory increased with very low speed. This means the number of houses hitting on market was not large enough. Fewer houses were put on market compared to the same time of last year.
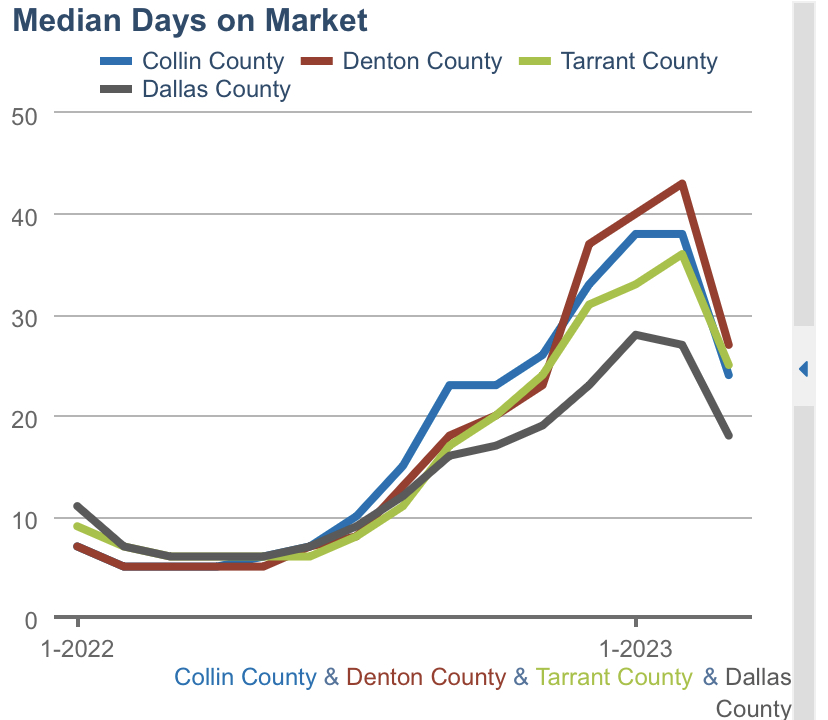
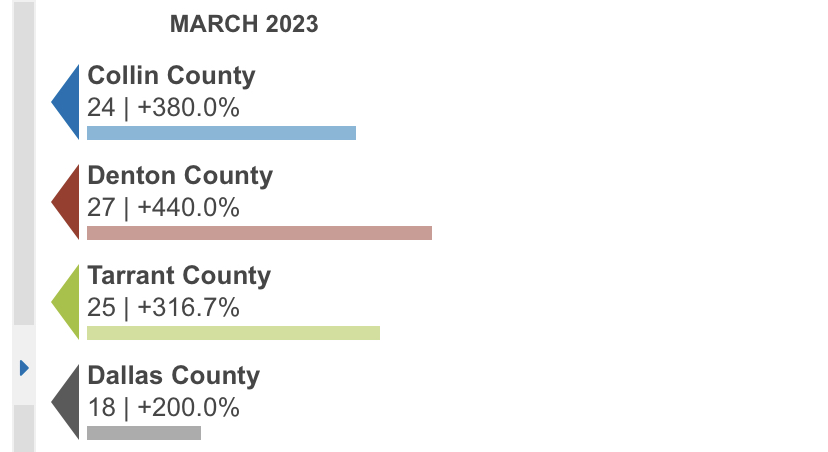
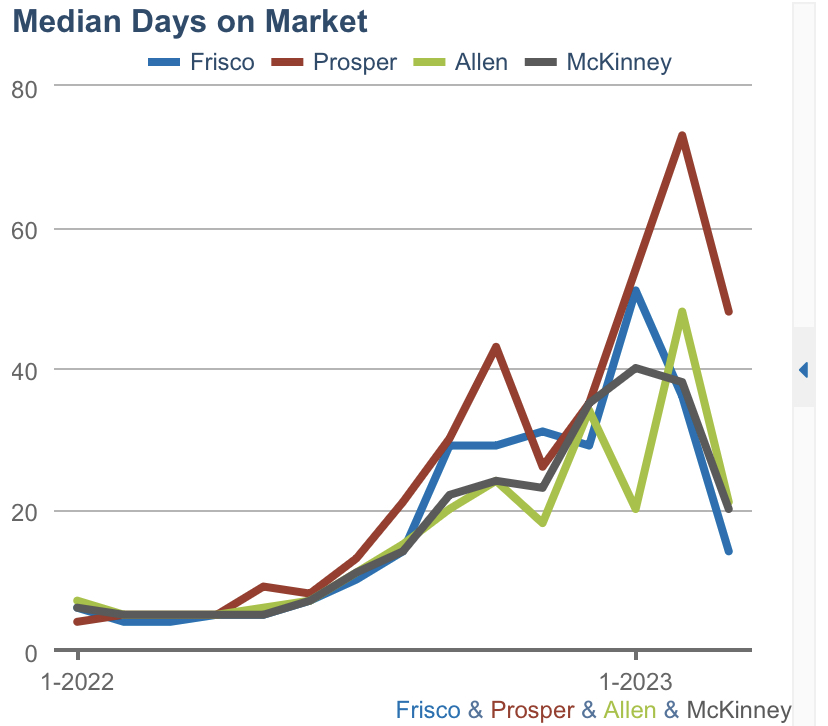
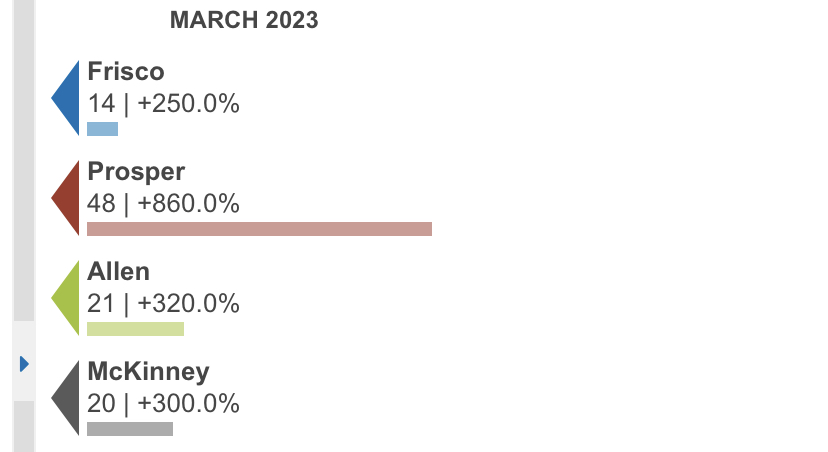
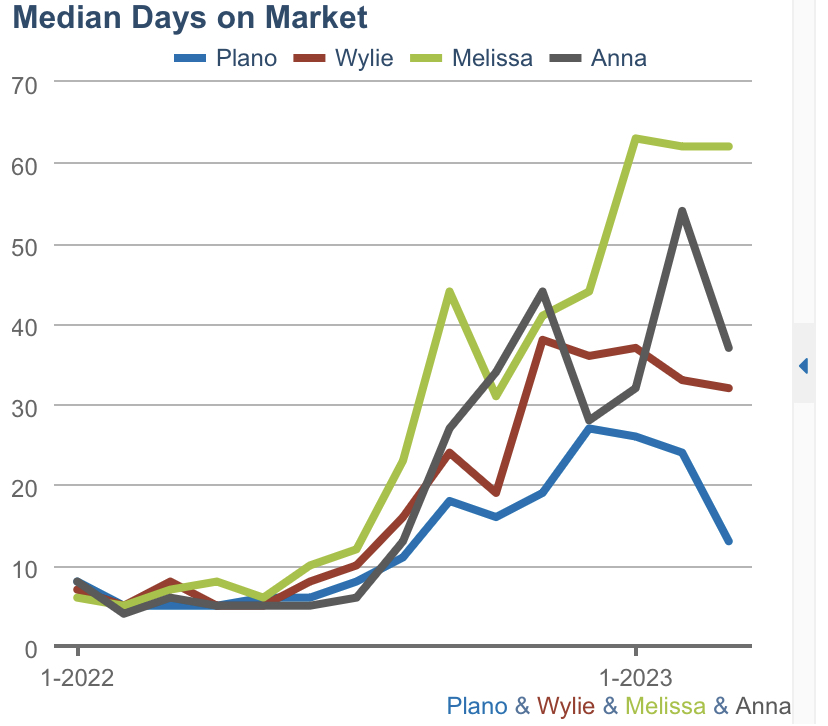
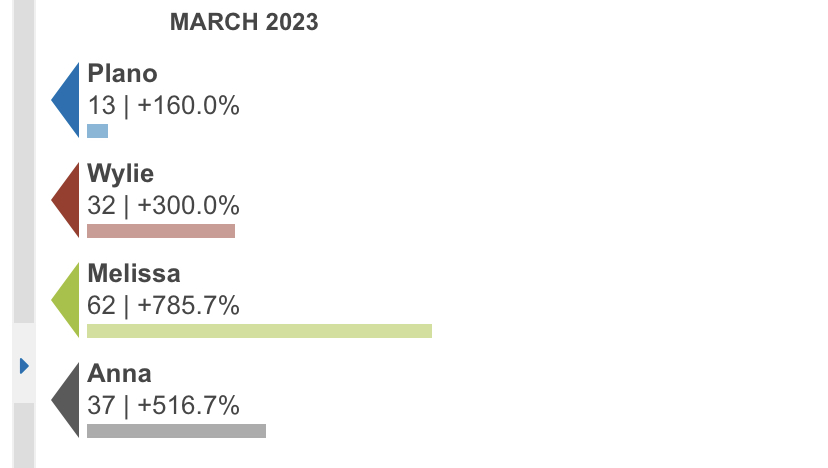
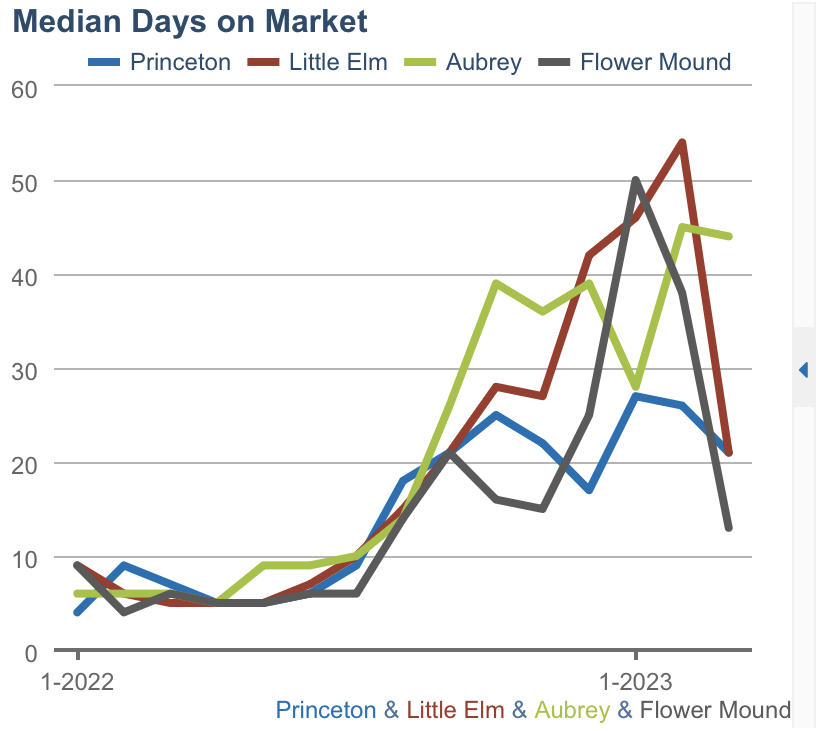
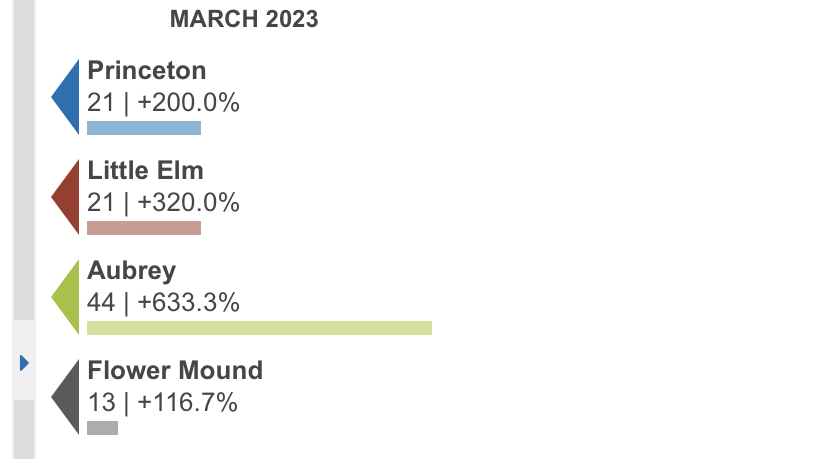
3. The days on market decreased sharply, which means sales went quicker.
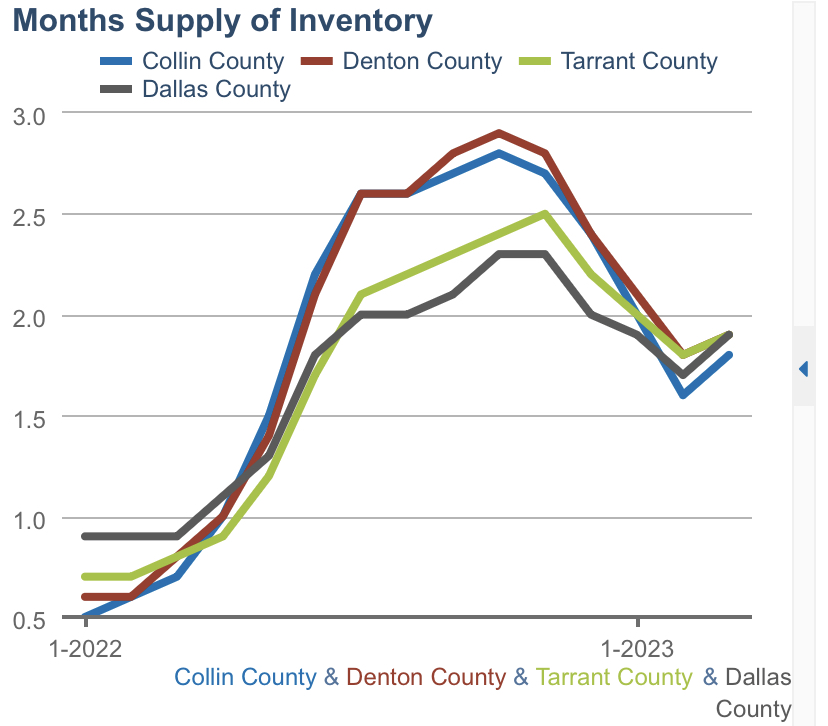
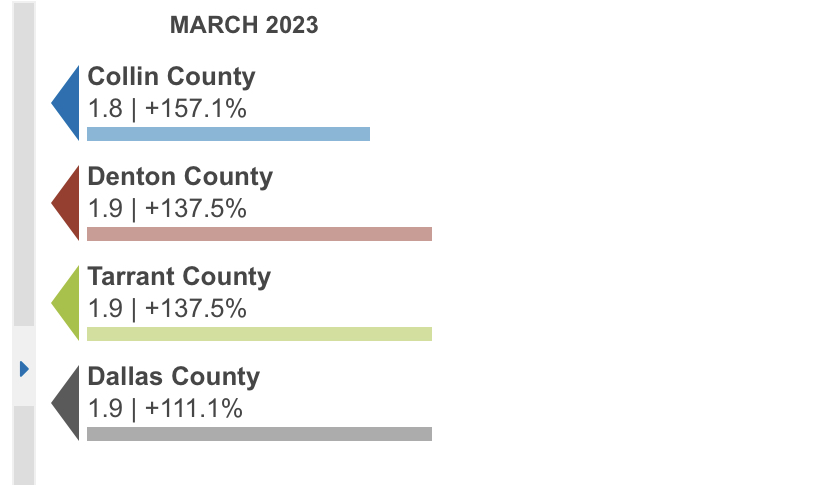
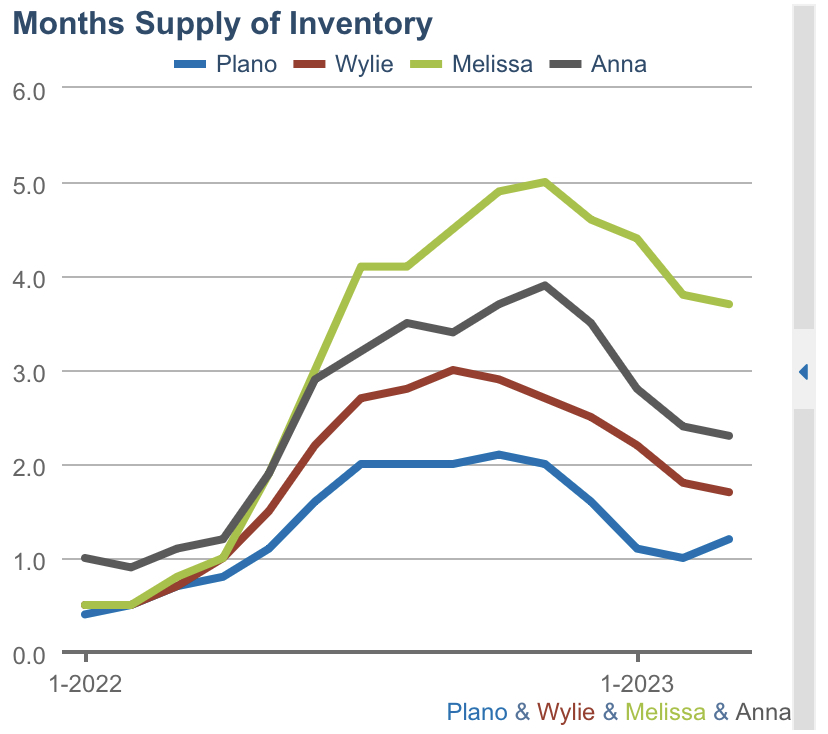
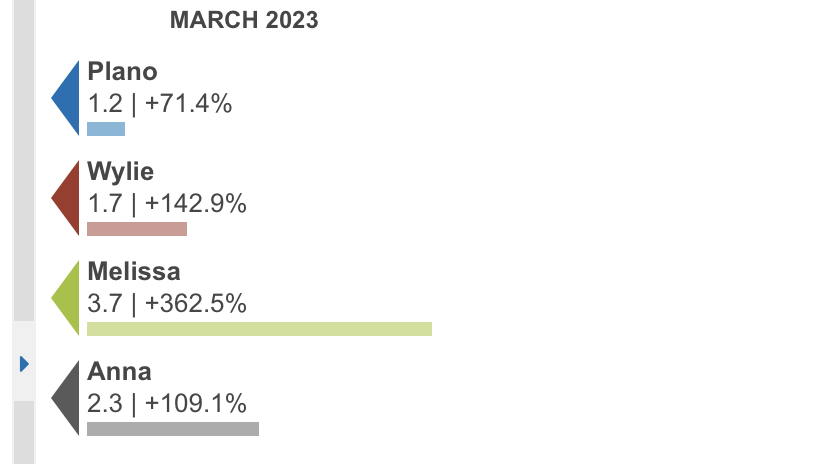
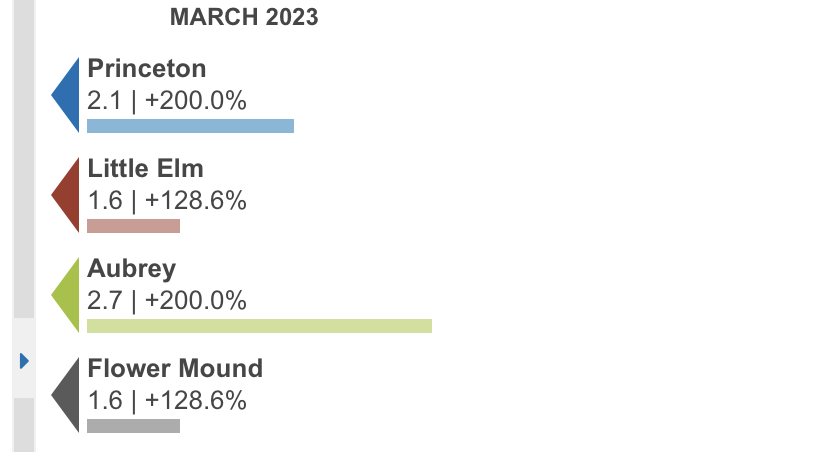
4. Even fewer houses were put on market comparing to last year, but the months supply of inventory increased, which means some houses stayed on market for longer time.
5. Houses with good conditions and good school districts were sold very fast, usually over just one weekend. Houses without such good school district or good conditions stayed long time on market.
Median price of Dallas area
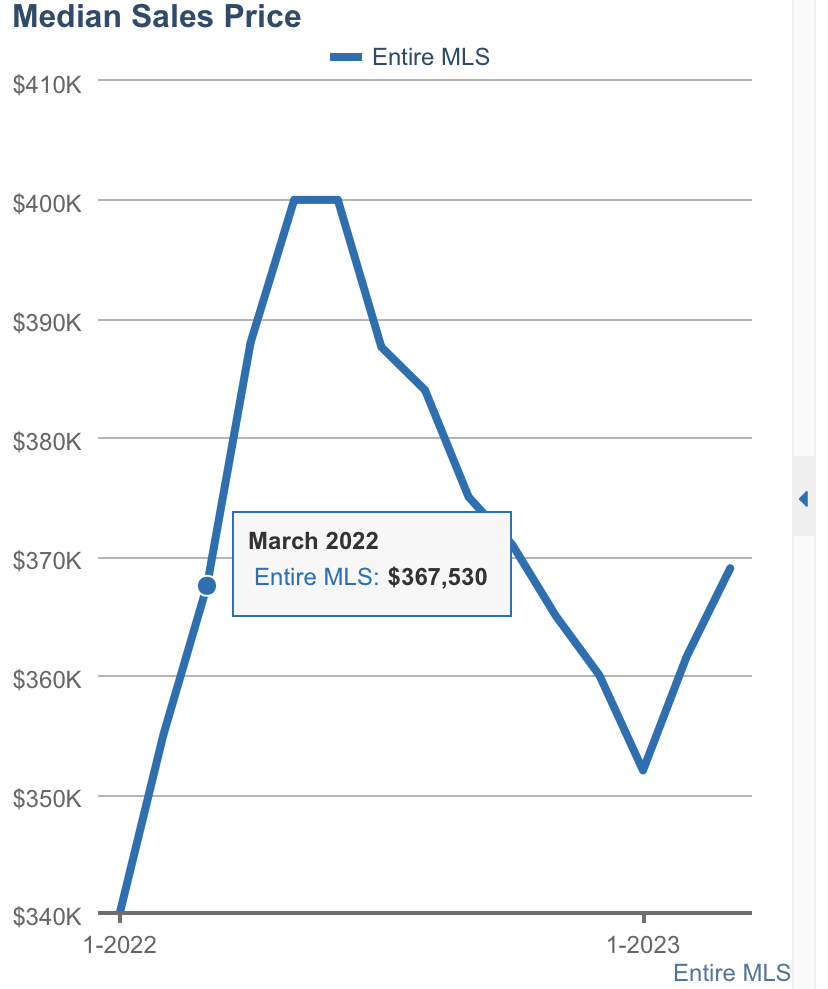
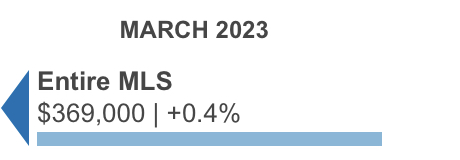
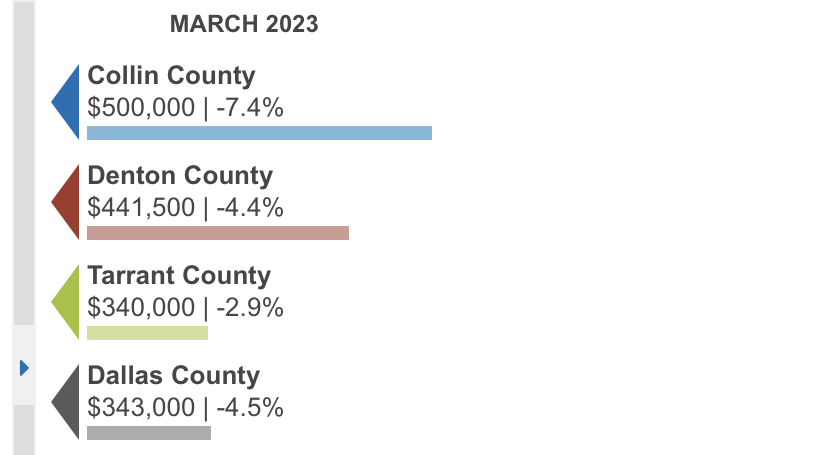
Median Prices with Changes at a glance
| County | the Highest | Median Sale Price($) | Compared to last year(%) |
|---|---|---|---|
| Collin County | 575,535 | 500,000 | -7.4 |
| Denton County | 500,000 | 441,500 | -4.4 |
| Tarrant County | 375,000 | 340,000 | -2.9 |
| Dallas County | 395,000 | 343,000 | -4.5 |
| City | the Highest | Median Sale Price($) | Compared to last year(%) |
|---|---|---|---|
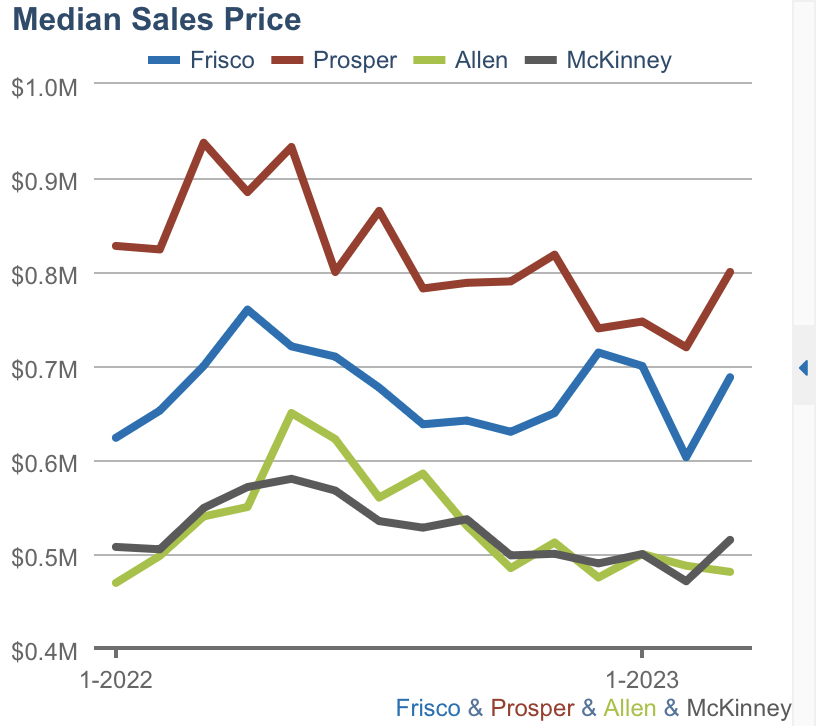
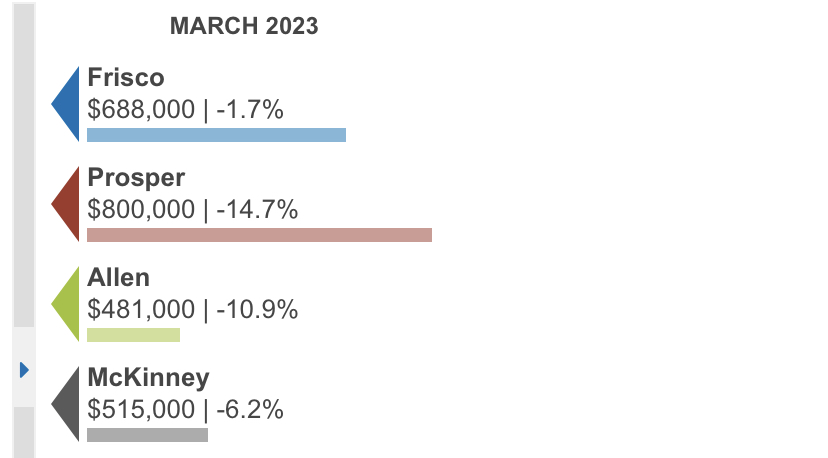
| Frisco | 760,000 | 688,000 | -1.7 |
| Prosper | 933,000 | 800,000 | -14.7 |
| Allen | 650,000 | 481,000 | -10.9 |
| McKinney | 580,000 | 515,000 | -6.2 |
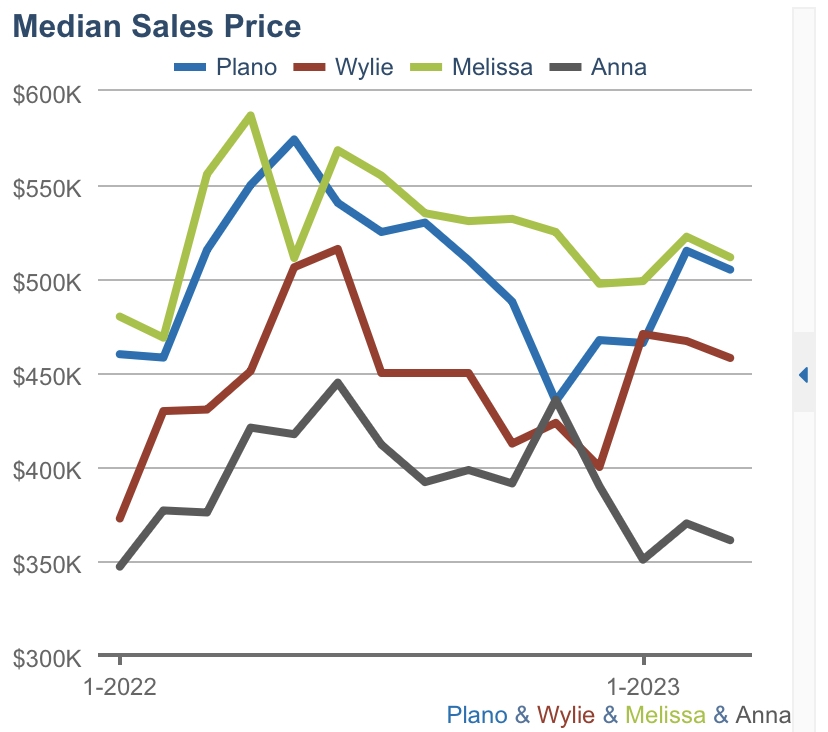
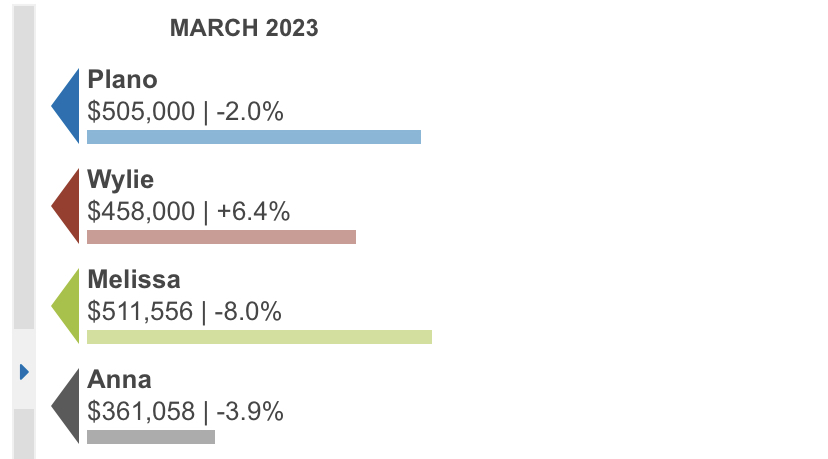
| Plano | 574,250 | 505,000 | -2.0 |
| Wylie | 516,000 | 458,000 | +6.4 |
| Melissa | 587,000 | 511,556 | -8.0 |
| Anna | 420,950 | 361,058 | -3.9 |
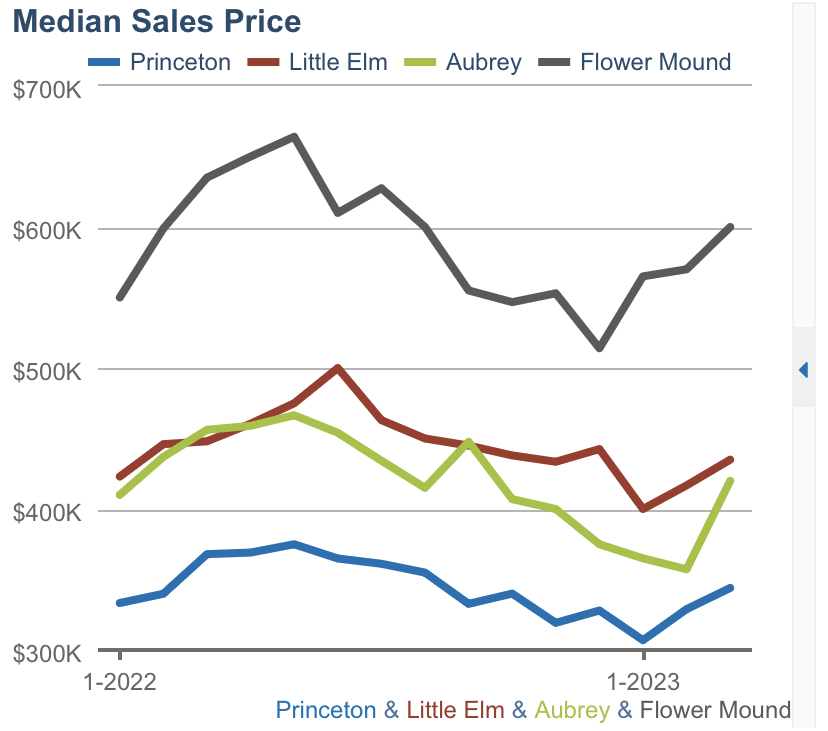
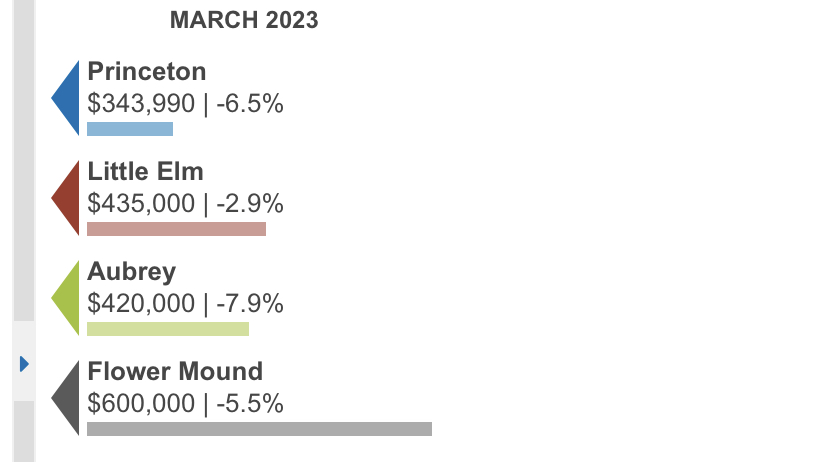
| Princeton | 375,000 | 343,990 | -6.5 |
| Little Elm | 500,000 | 435,000 | -2.9 |
| Aubrey | 466,500 | 420,000 | -7.9 |
| Flower Mound | 664,000 | 600,000 | -5.5 |
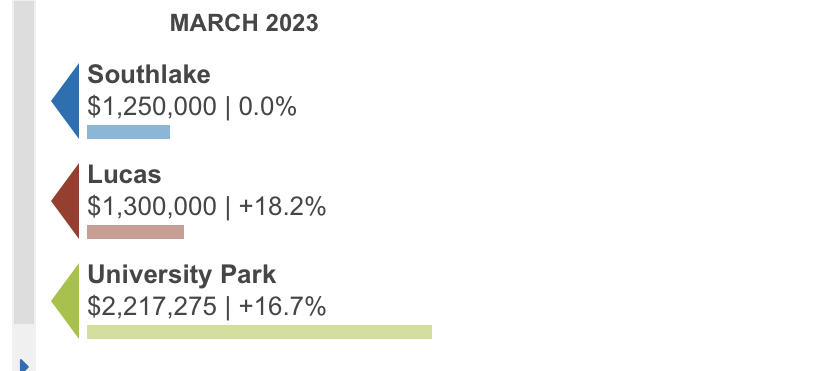
| Southlake | 1,515,000 | 1,200,000 | 0 |
| Lucas | 1,225,000 | 1,300,000 | +18.2 |
| University Park | 2,745,000 | 2,217,275 | +16.7 |
Collin - Denton - Tarrant - Dallas County
Median Sale Price
Days on Market
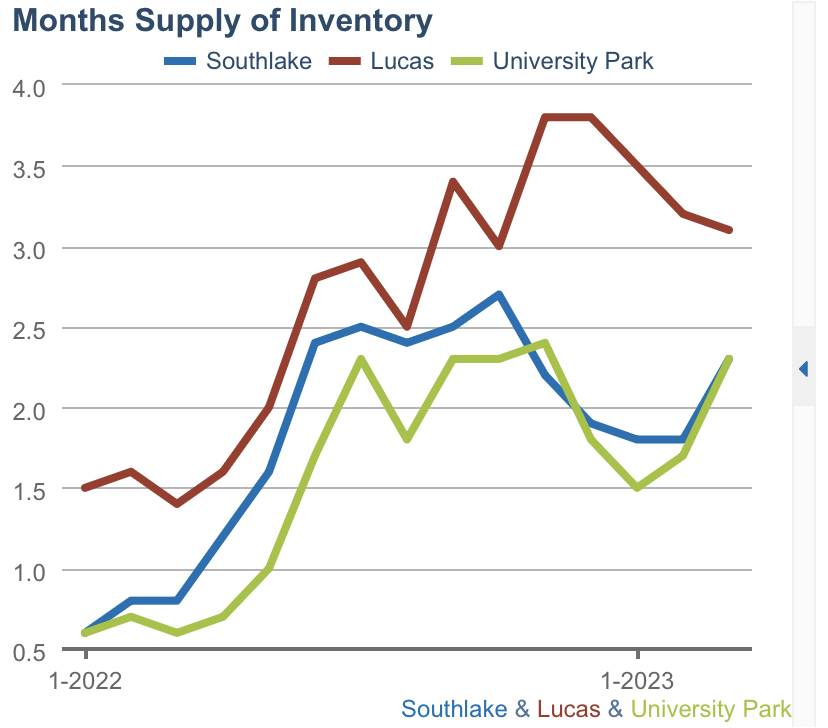
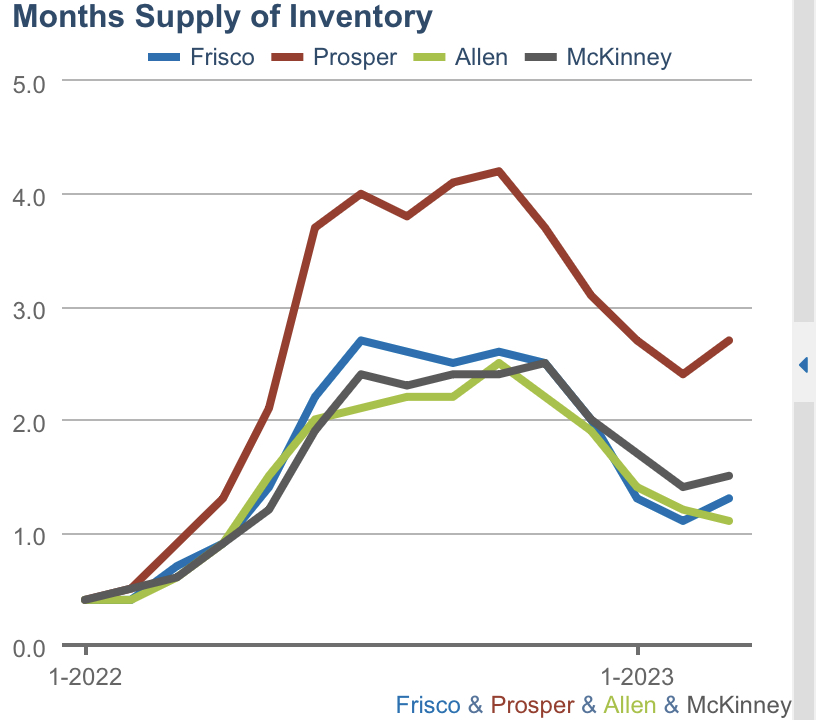
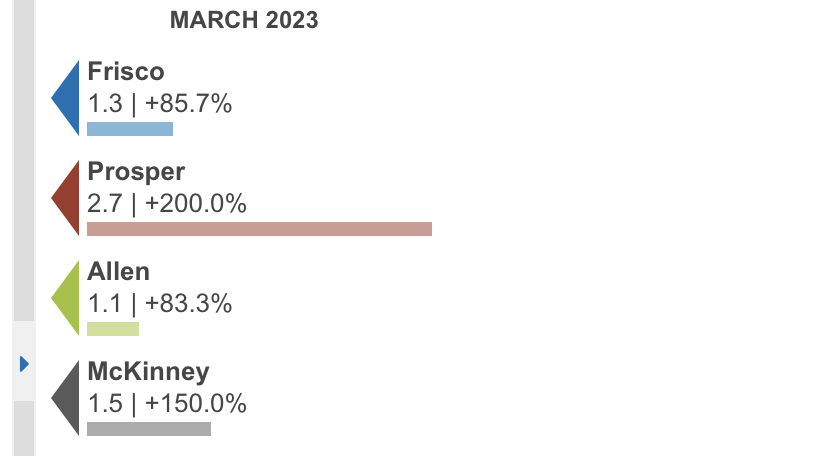
Months Supply of Inventory
Frisco, Prosper, Allen, Mckinney
Median Sale Price
Days on Market
Months Supply of Inventory
Plano, Wylie, Melissa, Anna
Median Sale Price
Days on Market
Months Supply of Inventory
Princeton, Little Elm, Aubrey, Flower Mound
Median Sale Price
Days on Market
Months Supply of Inventory
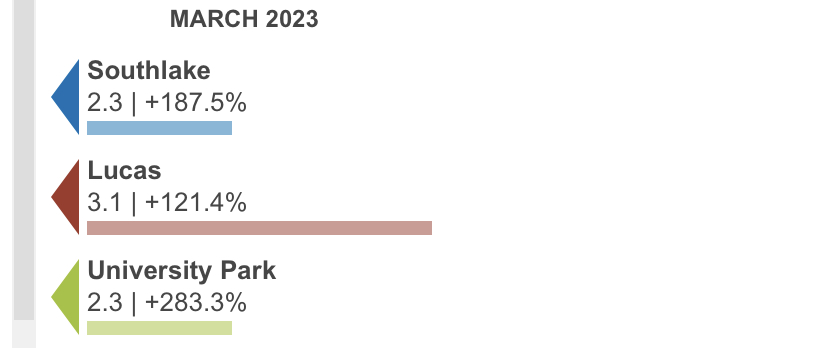
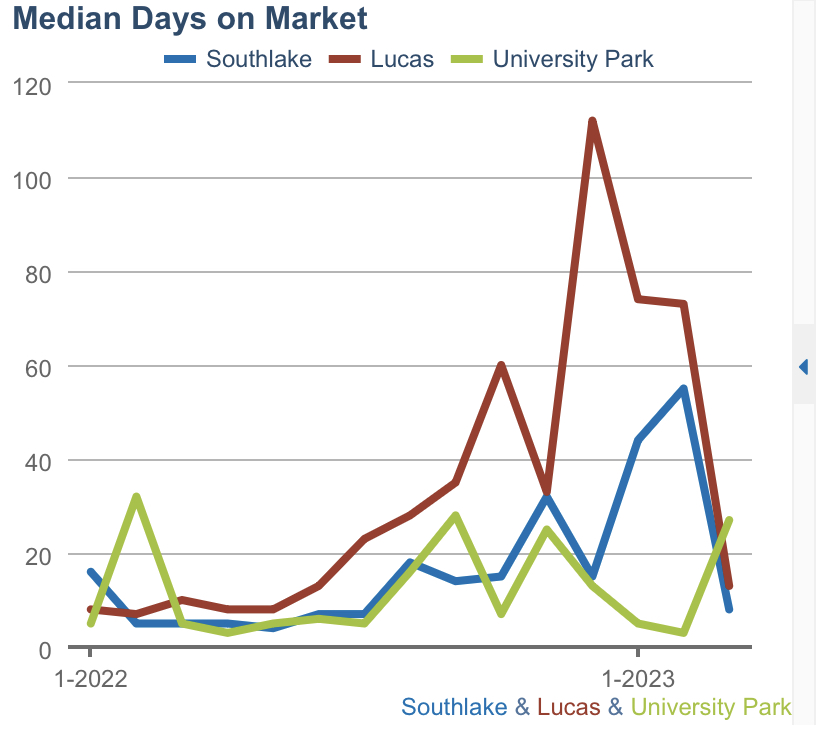
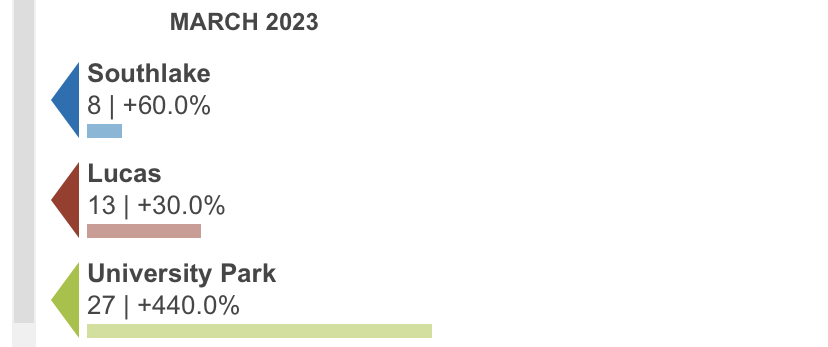
Southlake, Lucas, University Park
Median Sale Price
Days on Market
Months Supply of Inventory
