Dallas Real Estate Market - 2023-02


Summary
The market trends of February 2023 are as follows(Check out the charts below for details).
Key Takeaways
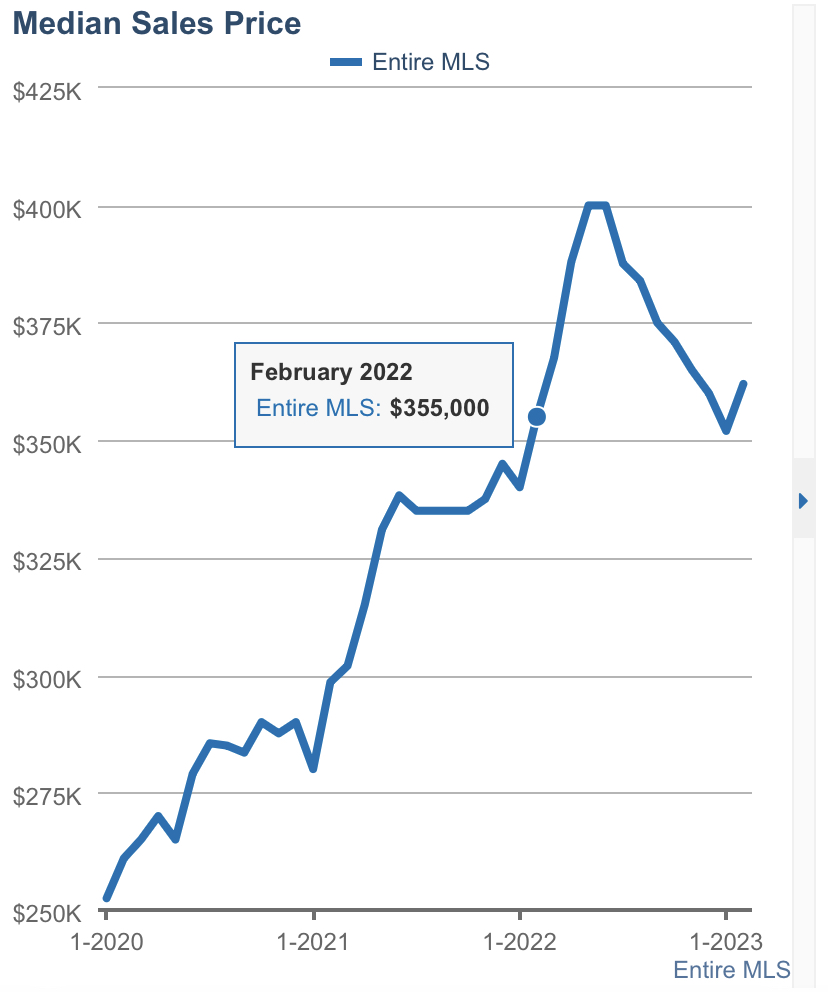
1. The price of the overall market continued climbing up.
2. The price of resale houses went up, but new construction went down.
3. The sale of new construction went slow, i.e. the last site of some project is still on market for over 20 days.
4. The sale of resale houses moved faster. More and more multiple offers and offer due date scenarios. Some houses stayed on market only for 1 day.
5. Monthly supply continues going down. I believe it is hard to see sale price goes down in near term because of the low inventory.
6. The prices in Frisco,Allen,etc. were lower than January. This is different from the feeling of the market. But the market becomes hotter, particularly for good schoold districts.
Median price of Dallas area


Median Prices with Changes at a glance
| County | Median Sale Price($) | Compared to last year(%) |
|---|---|---|
| Collin County | 492,250 | +2.3 |
| Denton County | 427,000 | -4.2 |
| Tarrant County | 339,000 | -0.9 |
| Dallas County | 351,800 | +0.9 |
| City | Median Sale Price($) | Compared to last year(%) |
|---|---|---|
| Frisco | 600,000 | -8.0 |
| Prosper | 719,916 | -12.6 |
| Allen | 490,000 | -1.6 |
| McKinney | 470,600 | -6.8 |
| Plano | 507,250 | +10.7 |
| Wylie | 467,000 | +8.7 |
| Melissa | 525,000 | +12.0 |
| Anna | 365,000 | -3.2 |
| Princeton | 328,995 | -3.2 |
| Little Elm | 416,750 | -6.6 |
| Aubrey | 357,245 | -18.3 |
| Flower Mound | 570,000 | -4.8 |
| Southlake | 1,119,000 | -5.6 |
| Lucas | 867,000 | -8.7 |
| University Park | 1,884,675 | -13.5 |
Collin - Denton - Tarrant - Dallas County
Median Sale Price


Days on Market

Months Supply of Inventory

Frisco, Prosper, Allen, Mckinney
Median Sale Price


Days on Market

Months Supply of Inventory

Plano, Wylie, Melissa, Anna
Median Sale Price


Days on Market

Months Supply of Inventory

Princeton, Little Elm, Aubrey, Flower Mound
Median Sale Price


Days on Market

Months Supply of Inventory

Southlake, Lucas, University Park
Median Sale Price


Days on Market

Months Supply of Inventory

